
See where your marketing money goes
The Money Map puts every lead source side by side: what you spent, the appointments it set, the sales it closed and the profit left after the job. It tells you where to put the next dollar and what to cut.
The cheapest lead is rarely the cheapest sale
Most contractors judge a source by cost per lead because that is the number on the invoice. You do not get paid for leads. A $45 lead that never sits costs more than a $90 lead that buys a roof, so the Money Map ranks sources by what a sale really costs.
| # | Source | Spent | Leads | Sales | Cost per lead | Cost per sale | Profit |
|---|---|---|---|---|---|---|---|
| 1 | Referrals | $600 | 15 | 5 | $40 | $120 | $23,900 |
| 2 | Google LSA | $7,200 | 80 | 9 | $90 | $800 | $36,900 |
| 3 | Door knocking | $6,000 | 60 | 6 | $100 | $1,000 | $22,350 |
| 4 | Angi | $4,800 | 96 | 2 | $50 | $2,400 | $4,300 |
| 5 | Home shows | $5,500 | 55 | 1 | $100 | $5,500 | −$1,125 |
| 6 | Facebook Ads | $9,000 | 200 | 1 | $45 | $9,000 | −$4,275 |
Ranked by cost per sale, Facebook Ads is your worst: $9,000 for one roof. Put the next $1,000 into Google LSA, where a sale costs $800.
Profit = sold × 35% margin after materials, labor and commission, minus marketing.
What the Money Map counts
Every number has one definition, used the same way on every screen and report.
- Cost per lead
spend ÷ leads. What each lead from a source cost you.- Cost per appointment
spend ÷ appointments set. What it cost to get on the calendar.- Cost per ran appointment
spend ÷ appointments where the rep sat with the homeowner. No-shows and cancellations are left out.- Cost per sale
spend ÷ jobs sold. What one customer cost you. The number that decides profit.- Close rate
jobs sold ÷ ran appointments. Counted the same way for every closer.- Profit after marketing
- What the jobs sold leave after materials, labor and commission, minus the marketing that brought them.
- Marketing ROI
profit after marketing ÷ marketing spend. Next to it, ROAS: sold ÷ spend.- A sale
- A job sold. A cancelled job comes off your numbers, and a no-show that gets rebooked keeps its history. Days follow your company’s time zone.
It tells you what to do, in plain words
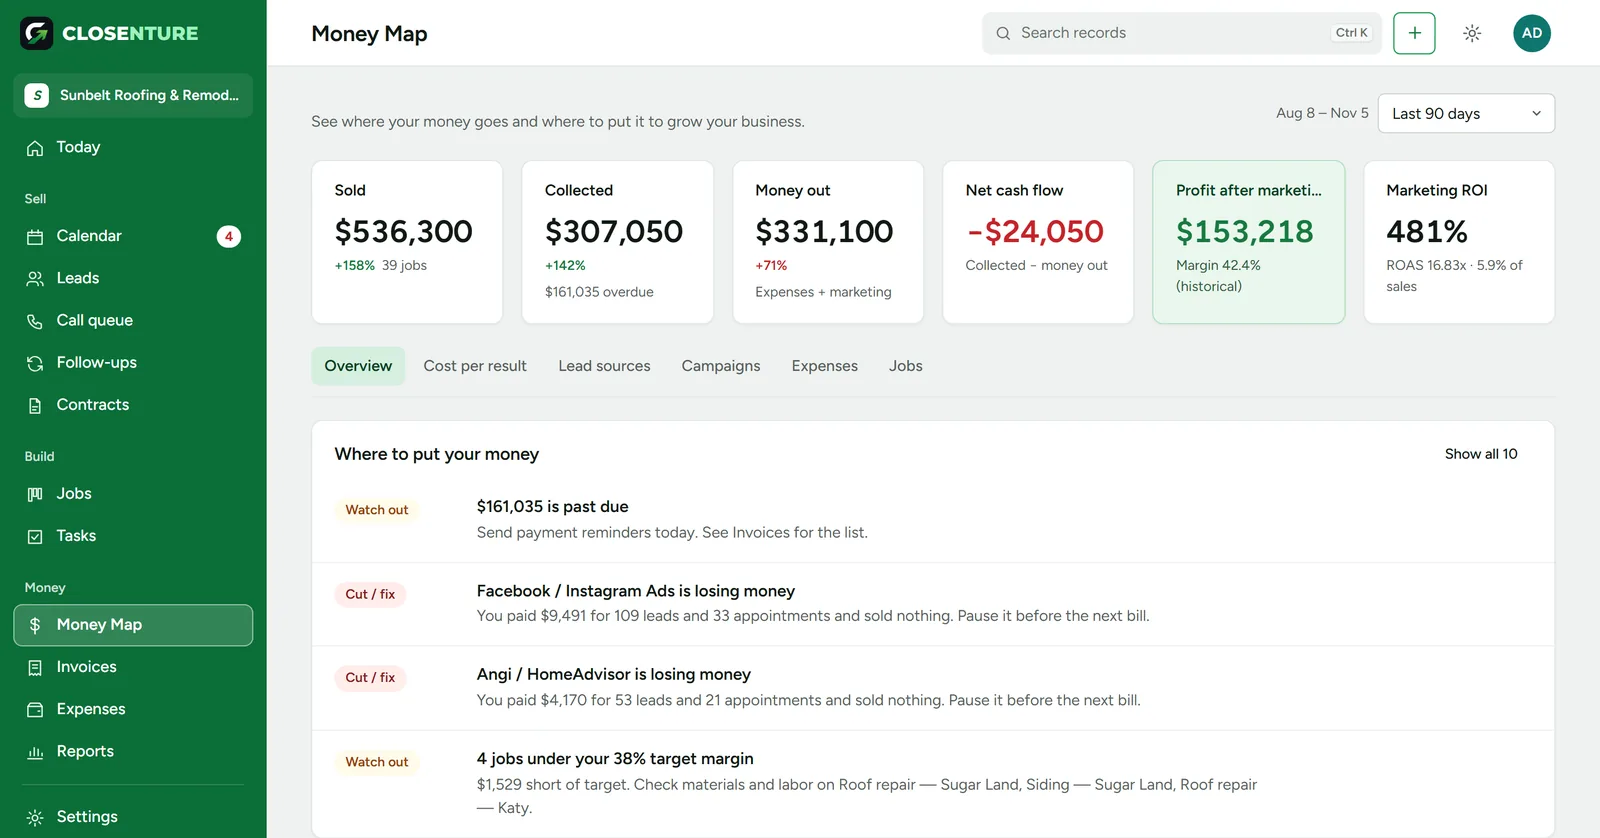
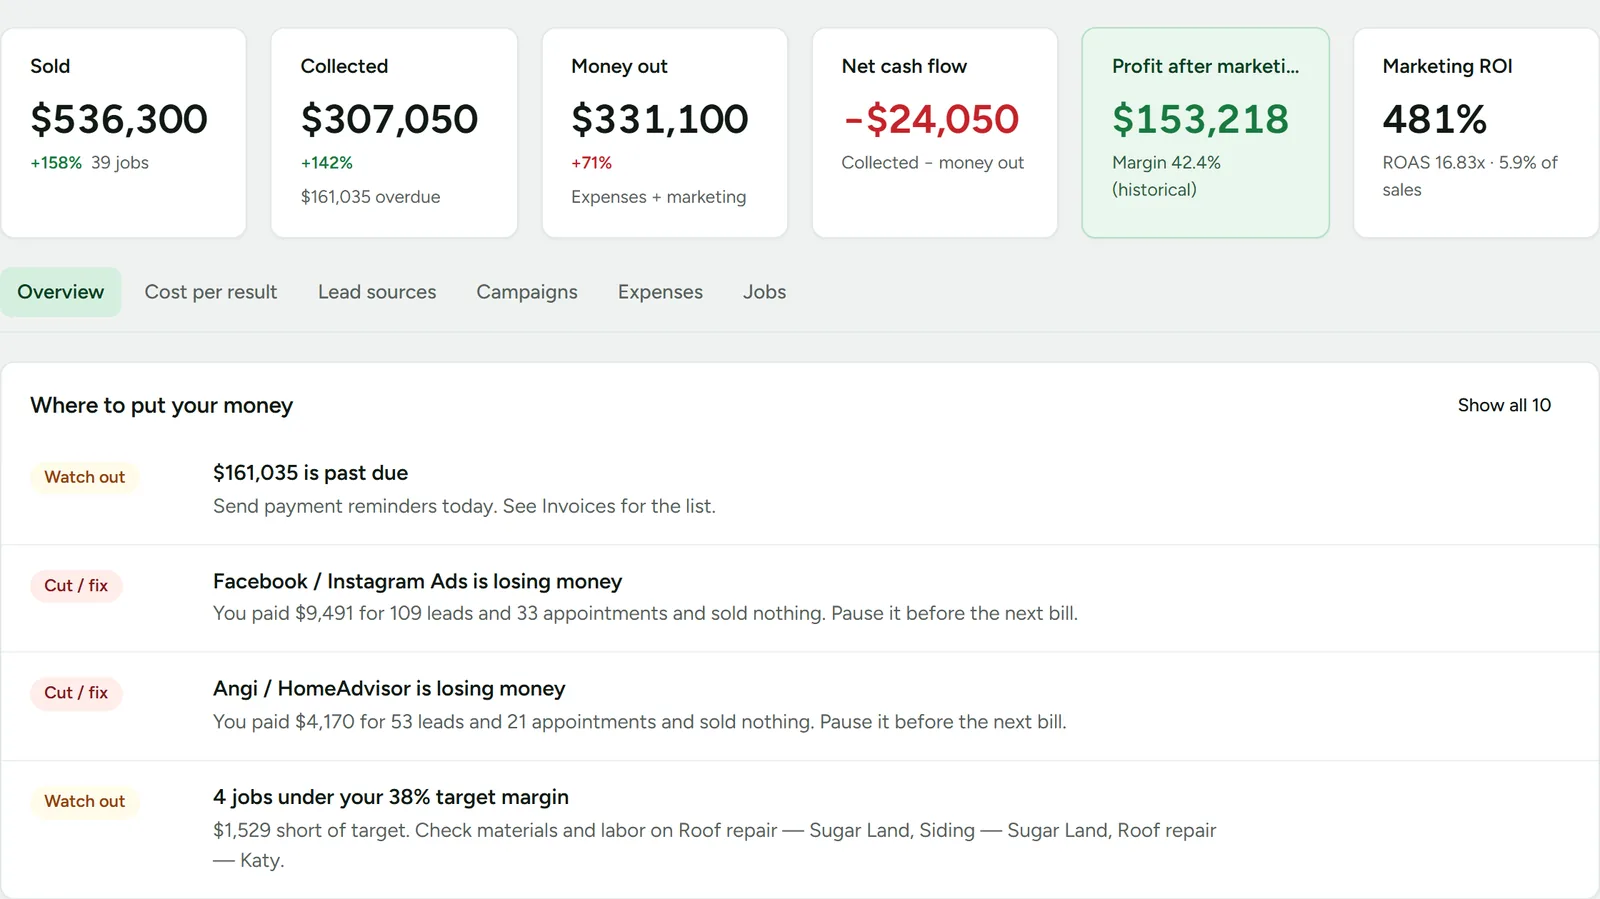
The Money Map reads the numbers for you. It flags a source that is losing money, jobs under your target margin and money past due, with a sentence like “Facebook / Instagram Ads is losing money. You paid $9,491 for 109 leads and 33 appointments and sold nothing. Pause it before the next bill.”
The same numbers on everyone’s Today screen
The owner sees sold, collected, spent and profit for the last 30 days the moment they sign in, next to the appointments that still need a result.

How the spend gets in
Enter what you spend on each source by month, or a cost per lead for sources that bill per lead, like Angi. Leads from your website forms arrive tagged with the ad that brought them (Google and Facebook click IDs and UTM tags), so each lead lands on the right source and campaign.
Put in your own numbers
Take three of your lead sources and the last 90 days: what you spent on each, the leads it brought and the sales it closed. The table ranks them by what a sale really costs you.
| Source | Cost per lead | Cost per sale | Profit |
|---|
Profit = sales × average job × margin − spend. Nothing you type leaves your browser.
See the real Money Map in the live demoQuestions
- It depends on your average job and margin. Your break-even is average job × gross margin. On a $15,000 roof at a 35% margin, any source where a sale costs more than $5,250 in marketing loses money on every job it brings.
- Cost per lead divides spend by leads; cost per sale divides it by jobs sold. A source with cheap leads that rarely sit or buy can have the worst cost per sale. See the full guide with a worked example.
- No. You can enter spend by hand each month or set a cost per lead per source. Website leads are tagged with the ad click automatically once the Closenture code is on your site.
- Yes. Profit is what is left after materials, labor and commission, so a source that brings low-margin jobs shows it.
- Yes. Each setter and closer has a scorecard (booked, confirmed, ran, sold, close rate) counted the same way as the Money Map.
Book a demo
We call you back, in English or Spanish, to set up a 20-minute demo with numbers like yours. Rather look first? Open the live demo or write to [email protected].